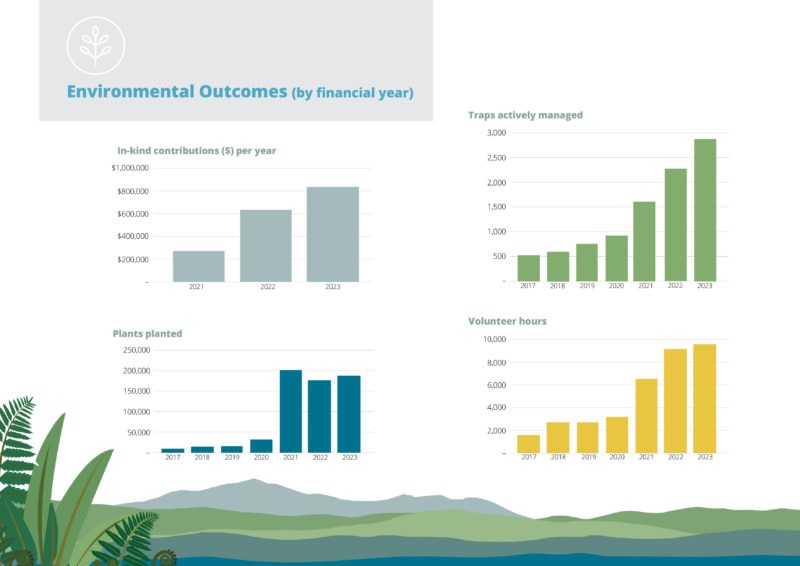
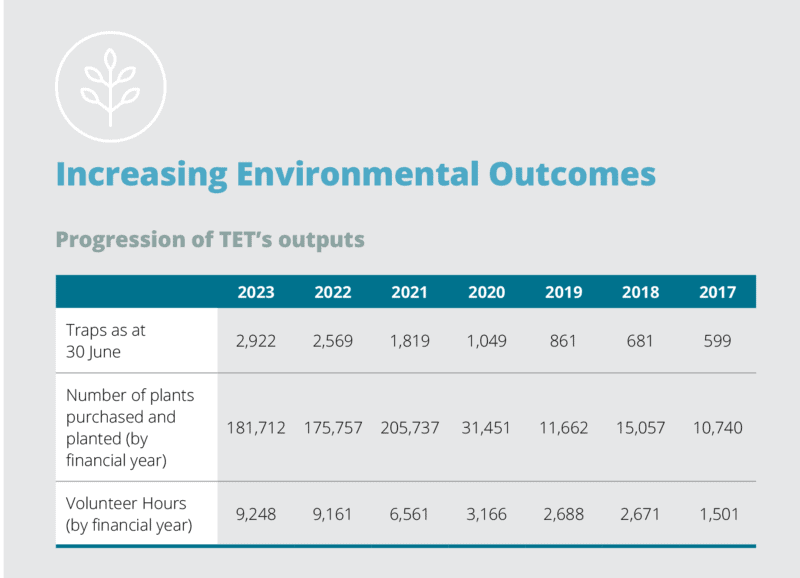
Please note that the trap figures are taken from traps logged on Trap NZ as at end June each year. These are a cumulative figure.
Plants purchased and planted can fluctuate year to year based on funding but also because the financial year ends in the middle of the planting season. If more plants are planted in the first part of the planting season, they will be counted in that financial year. However, if the planting season runs late then they will not be included until the next financial year.

In kind contributions include landowner contributions towards site prep and maintenance, donation of office space, estimated value of volunteer hours, donation of supplies such as bamboo stakes for plant guards, and the donation of professional hours. These significant contributions make a massive positive difference to conservation work in our region.